Halifax Weather - The Last Year(s)
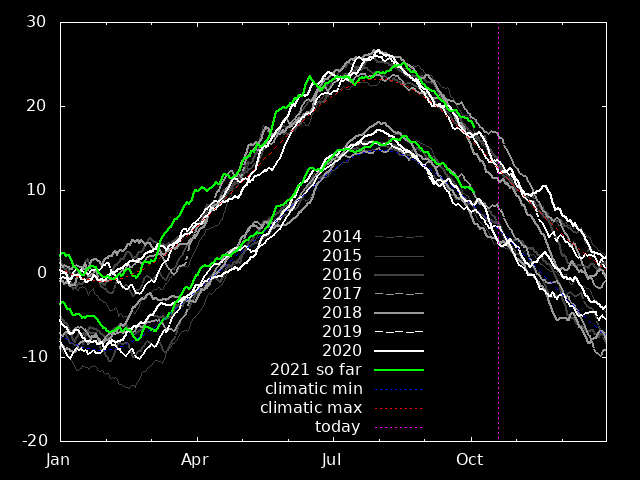
30 day means are calculated from daily minimum and maximums.
The green line shows the year so far. It lags by 15
days from todays date because of the 30 day averaging.
Dashed lines are a simple curve fit to the Climate from 1933 to 1990.
Note that daily minimum and maximums are computed
from hourly temperatures which are under-sampled compared to the real
temperatures - so the wiggly maximum curves should be
a bit higher, and the wiggly minimum curves should be a bit lower.
![]()
![]()
![]()
![]()