Darwin Weather - The Last Year(s)
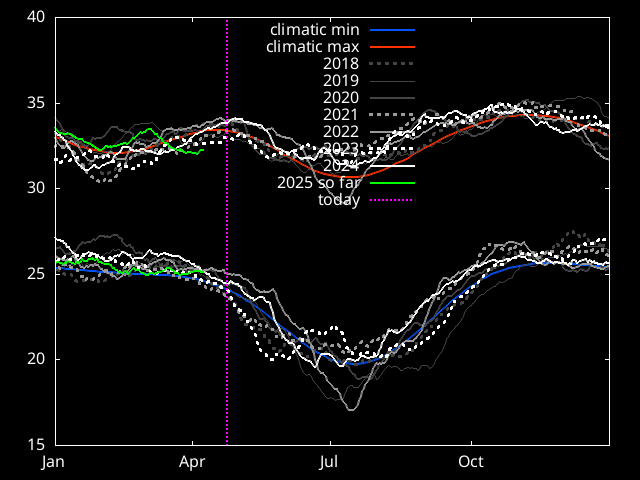
30 day means are calculated using daily min/max data from BoM.
The green line shows the year so far. It lags by 15
days from todays date because of the 30 day averaging.
Dashed red/blue lines are a curve fit to the Climate since 1869 at a nearby site.
![]()
![]()
![]()
![]()
![]()
![]()
![]()